

The VIX is commonly known as the fear index because it is typically associated with declines in the stock market.
However, this is not an accurate assessment of the VIX index. In actuality, the VIX is a measure of the magnitude of the move in the stock market, not the direction. When the VIX is high, it simply means that the market will incur large swings. (VIX is the ticker symbol and the popular name for the Chicago Board Options Exchange’s CBOE Volatility Index, a popular measure of the stock market’s expectation of volatility based on S&P 500 index options.)
Why Fear Volatility?
Why do investors fear volatility? Perhaps, because most investors have little tolerance for risk, which is synonymous with volatility and tend to run away from it by quickly selling their investments causing large down movements in the stock market. It’s always better to shoot first, ask questions later.
In finance, volatility (usually denoted by σ) is the degree of movement of a trading price over a period. The most common method of measuring volatility is through calculating the standard deviation. The formula below, shows that by squaring each period minus its average always gives a positive result. Thus, volatility is not directional, but a measure of magnitude.

What if volatility led to positive returns? What if investors learned to embrace volatility by accepting compensated returns for the level of risk they are taking? What if high volatility can be associated with large returns and small drawdowns in capital? To explore this idea further we look at the charts below. For illustrative purposes, we show three different types of investments with monthly and cumulative returns over one year. We see that volatility can take many forms.
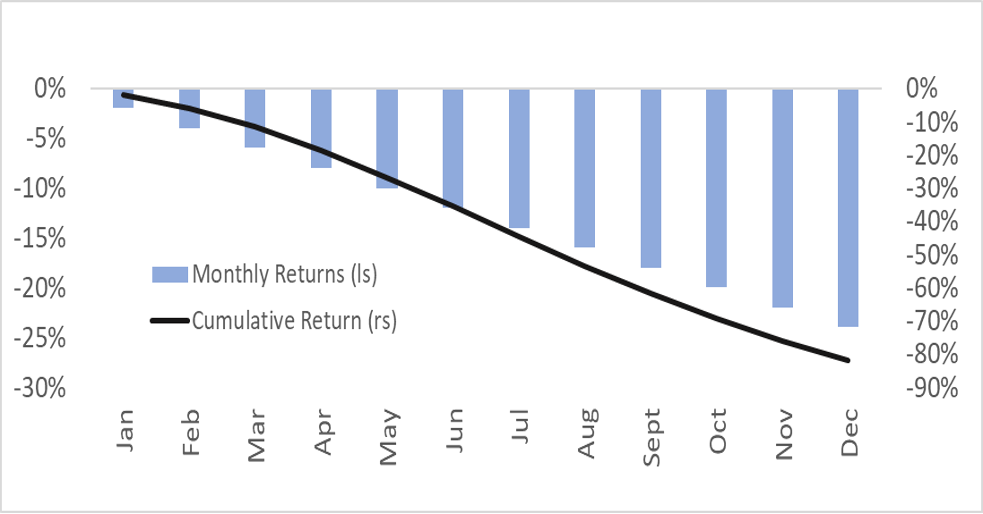
INVESTMENT A
Investment A (see below) is an example of the typical type of volatility that most investors are accustomed to seeing, volatility that is associated with negative returns. Investment A shows increasing negative monthly returns throughout the year and a total return of -82%.
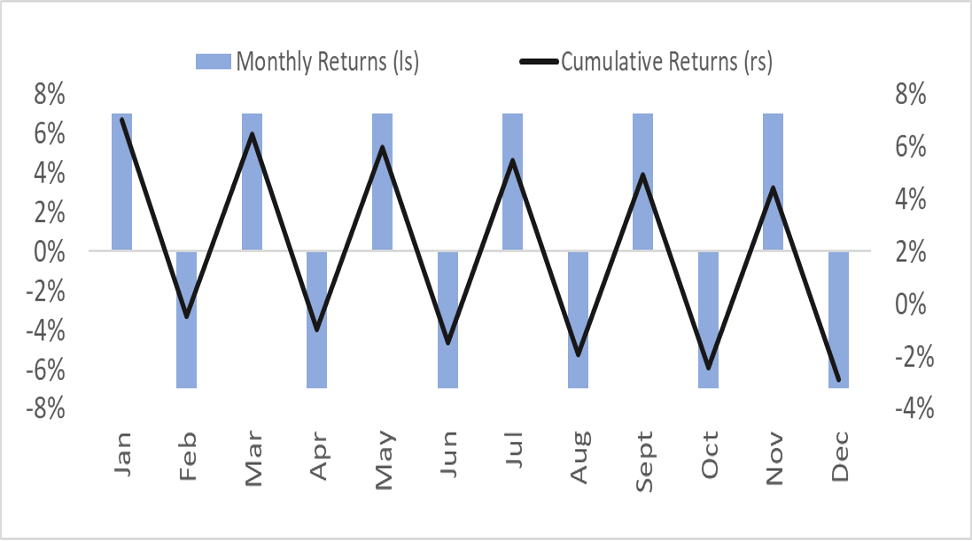
INVESTMENT B
Investment B below shows equal but alternating returns each month. In this example, we show +7% and -7% monthly returns throughout the year resulting in a total return of -3% at the end of the year.
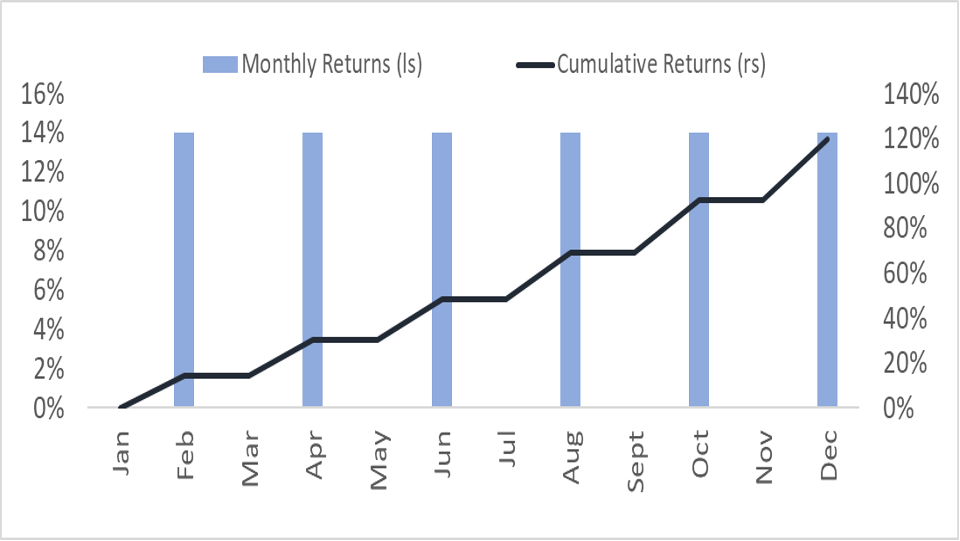
INVESTMENT C
Investment C shows 14% gains every other month and a total return of +119%.
What if all three investments above have the same volatility of 25% annualized? Which investment would you pick? The first one leads to a total return of -82%, while Investment B has a cumulative return of -3% and Investment C has a total return of +119%. Would you not accept 25% volatility, if you could achieve the monthly gains of the last investment? An investor would surely choose no down months and 119% total return.
I will ask again, why do investors fear volatility? Perhaps the more rational answer is, they should not if they are being compensated for risk and in this case the volatility, they are willing to accept. How do we find investments that compensate one for volatility? To answer this, we turn to the Sharpe ratio.
A Sharpe Turn
In the investment world, the Sharpe ratio measures the performance of an investment, defined as the difference between the returns of the investment divided by the standard deviation of the investment (i.e., volatility). It represents the additional amount of return that an investor receives per unit of increased volatility. Investment A has a negative Sharpe ratio of -6.2, while Investment C has a Sharpe ratio of 3.3. Obviously, these examples are overstated to make a point.
So, what is considered a good or bad Sharpe ratio? To put things in perspective the S&P 500 has a Sharpe ratio of 0.6 over the past 20 years. One could argue that anything below the market ratio would be an undesirable investment and anything above would favorable. Does that mean investors should create a portfolio with investments that have the highest Sharpe ratio? Probably not. Not all investors are looking for the best risk adjusted return. Many investors seek a lower return and lower risk depending on their investment profile, their portfolio construction, their time horizon and many other factors.
Do Not Fear Volatility
Investors should not be afraid of volatility simply because it is high. Investors should always look below the hood to see the return associated with the volatility and see if it makes sense for them.
About Heeten Doshi
Heeten Doshi is the founder of Doshi Capital Management and manages the firm’s equity marketing timing strategy, the Doshi Systematic Strategy Fund. Mr. Doshi was formerly a senior equity strategist at Brown Brothers Harriman, where he focused on the US economy, equity market and provided investment recommendations to global institutional clients including hedge fund, asset management and pension funds. Prior to that, Heeten worked at Morgan Stanley as an equity research analyst where he conducted deep-dive fundamental company analysis and at Lehman Brothers where he was a derivatives trader and hedged the firms $14bn fixed income portfolio. Heeten has received two graduate degrees – an MS in Accounting from the University of Illinois GEIS Business School and an MS in Management from Babson F.W. Olin Graduate School of Business. He has also completed the Asset and Portfolio Management program at the University of Pennsylvania Wharton School. He holds a Bachelor’s degree in Finance from Rutgers University and has obtained the CFA designation.